Monitoring servers
Each week we assign somene to be on duty at weekend and keep an eye on loads and errors. Wednesday nights might also need a glance sometimes. This describes what needs doing.
You need an AWS account, and if you have MFA enabled, an authentication method (e.g. Google Authenticator app to give you 6 digit codes).
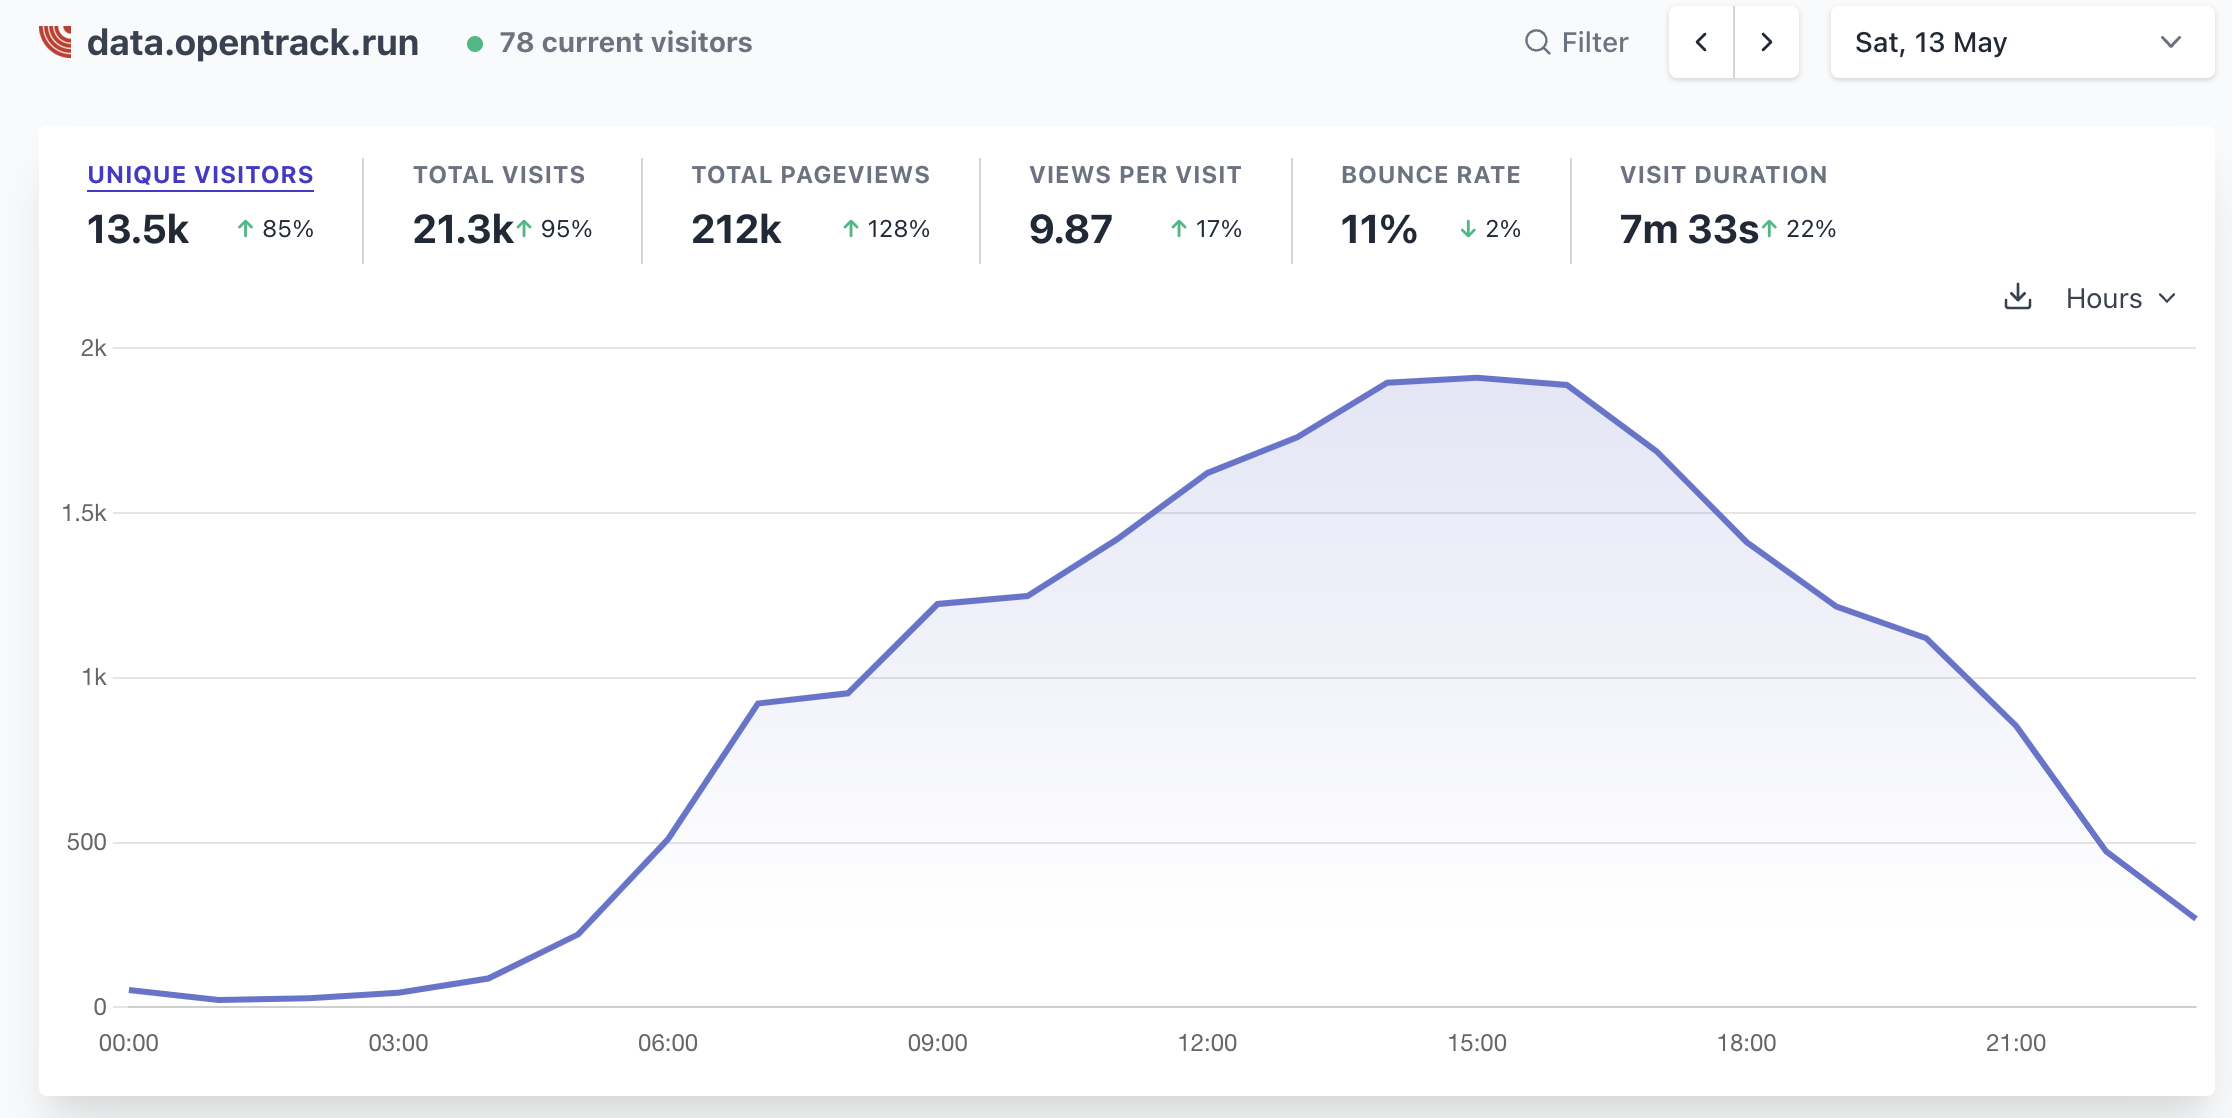
When on duty, drop a note on the chat so others know you are around that day. For capacity monitoring it's generally sufficient to check in 3-4 times - no need to be glued to a screen. The graph of one of our busiest ever days is below:
Pages to watch
Open up these in browsers - the first two should be checked, the other links are "as needed"
- Scaling - Our own simple page to scale AWS services (Without AWS login)
- Analytics - who is on the site
- AWS Dashboard - the graphs we watch to see how busy we are
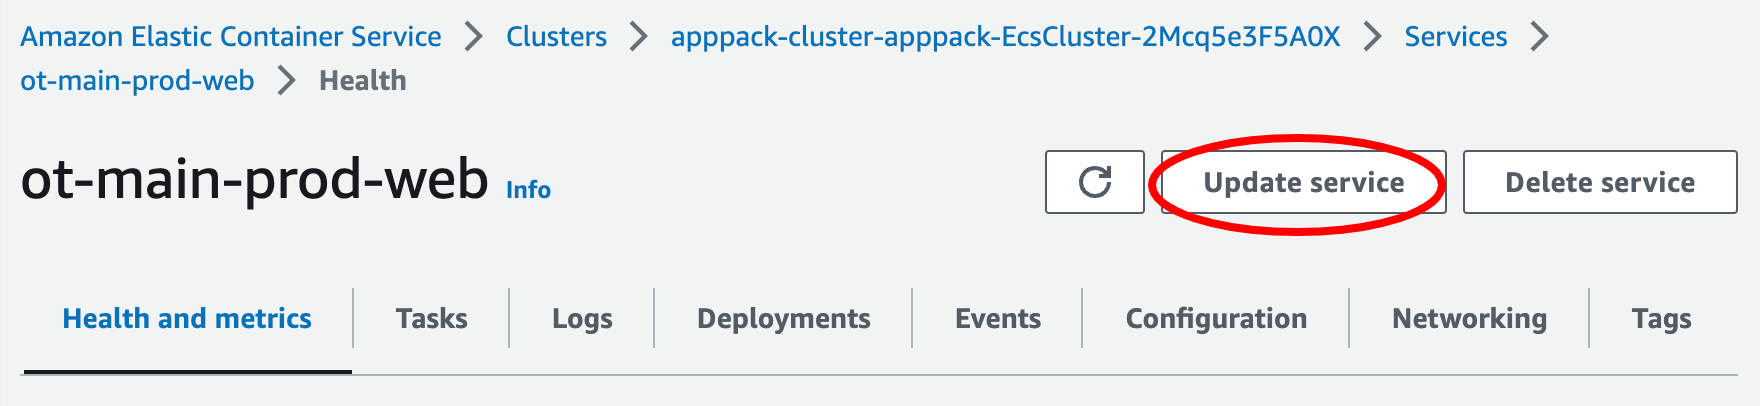
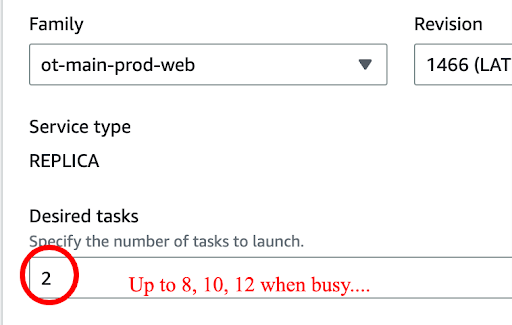
- ECS web task - "Update Service" then change number to dial up or down web servers.
- DocumentDB - Add read replica databases
- Sentry - Django error logs
- Background Tasks - our table tracking any that got stuck
Check the calendar and guess how many competitions are on doing results with us, and check when they start. Some are in time zones 2 hours ahead, so a lunchtime start might mean 10:00 here.
Typically on a Saturday morning I will go up to 4 web servers, and add a second DocumentDB instance, around 9 in the morning. Sometimes officials are logging in, preparing field cards etc, and you get brief "spikes", so best to have a bit more capacity
As things "hot up", one can add more web workers (as web service chart gets busy) and more replica databases (as the DocDB / DocDB2 graphs get above 50%)
In the evening, turn them down again! Sometimes I do this in a couple of steps, as a lot of people are looking early evening, although competitions are over.
Scaling up servers through AWS
Scaling DocumentDB through AWS
This is Amazon's MongoDB variant, that holds most of the in-competition data. There are two charts on the dashboard showing a fairly long-term average chart of the first and (if enabled) second instance.
The cluster page linked above also has better indications of how busy the instances are on the right. The writer will always be low on a Saturday, and the readers will share the load. So, if readers are above 50%, and the afternoon migth get busier, turn on another one just in case.
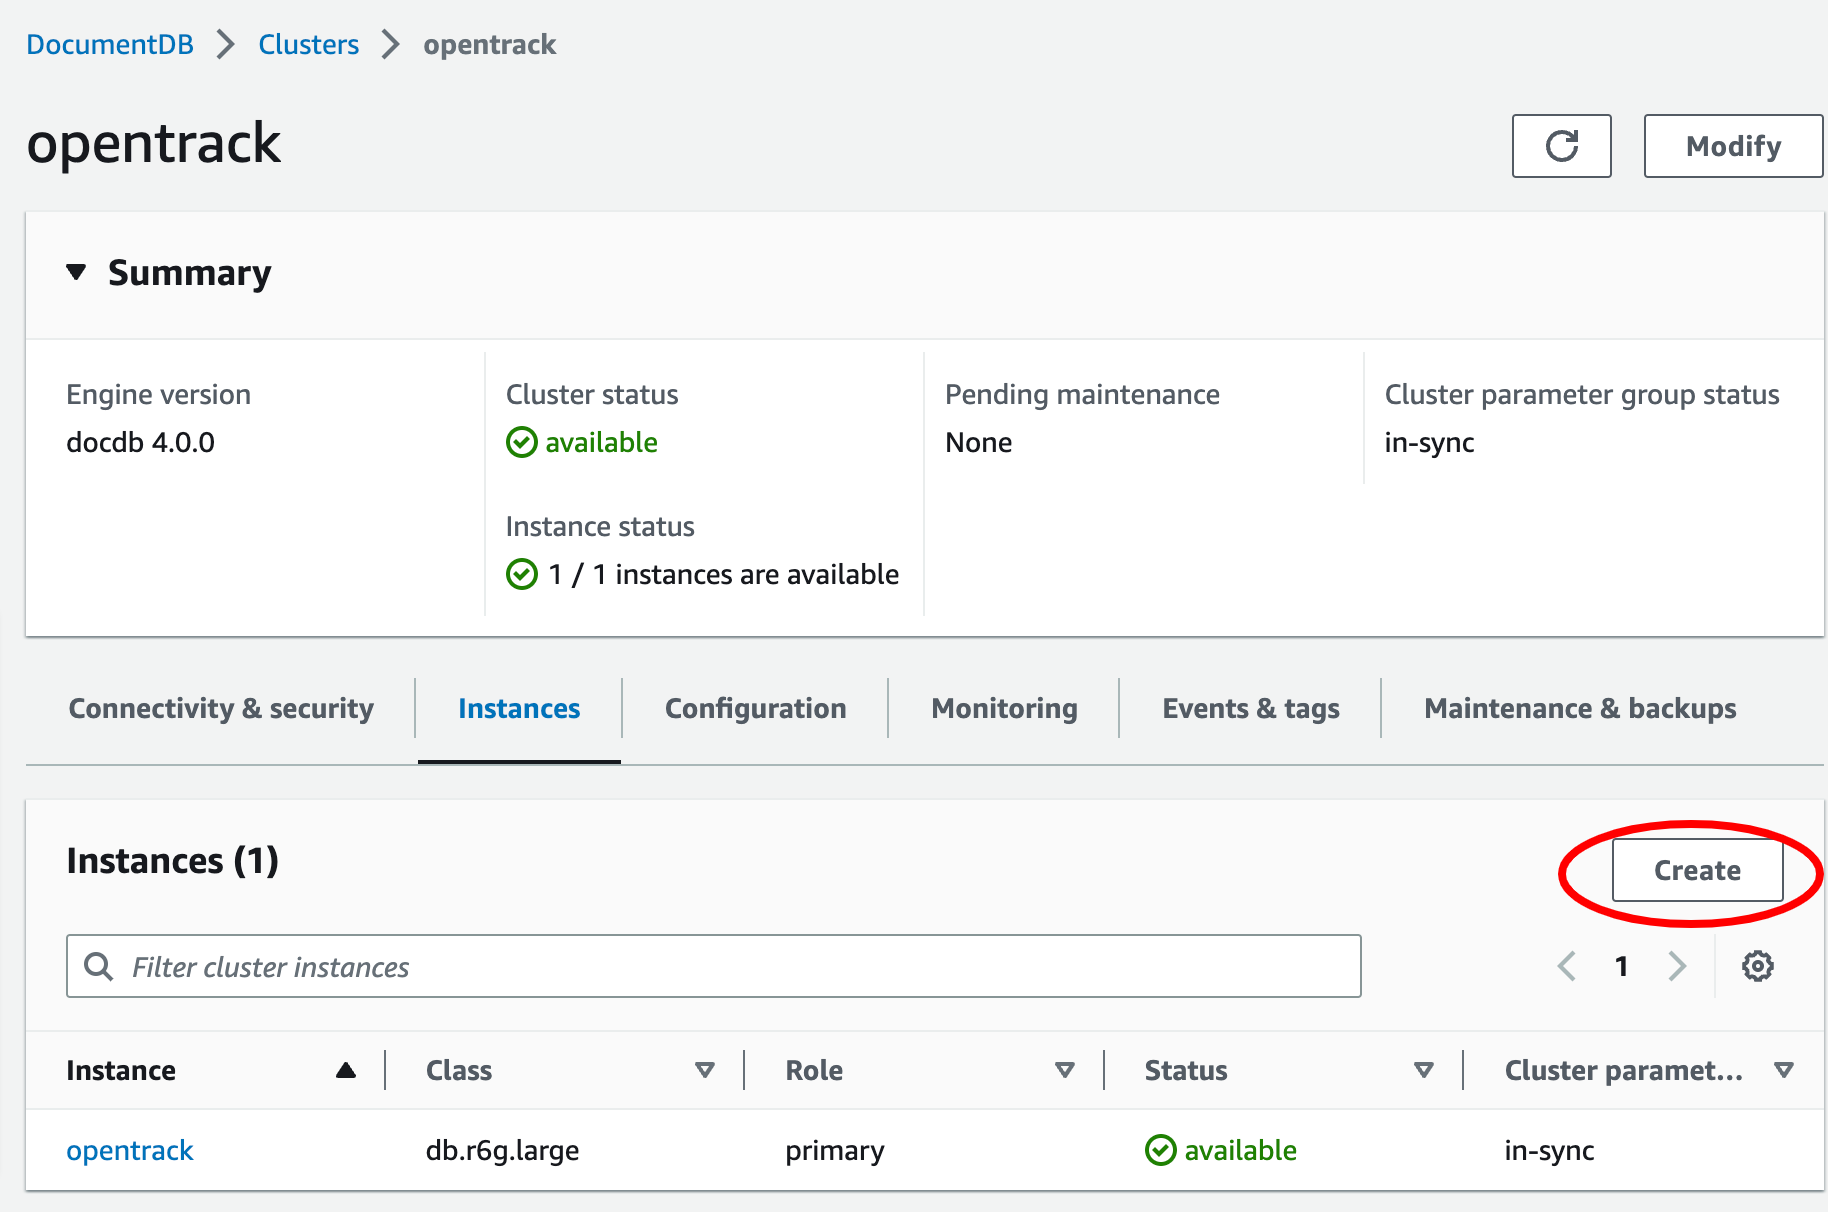
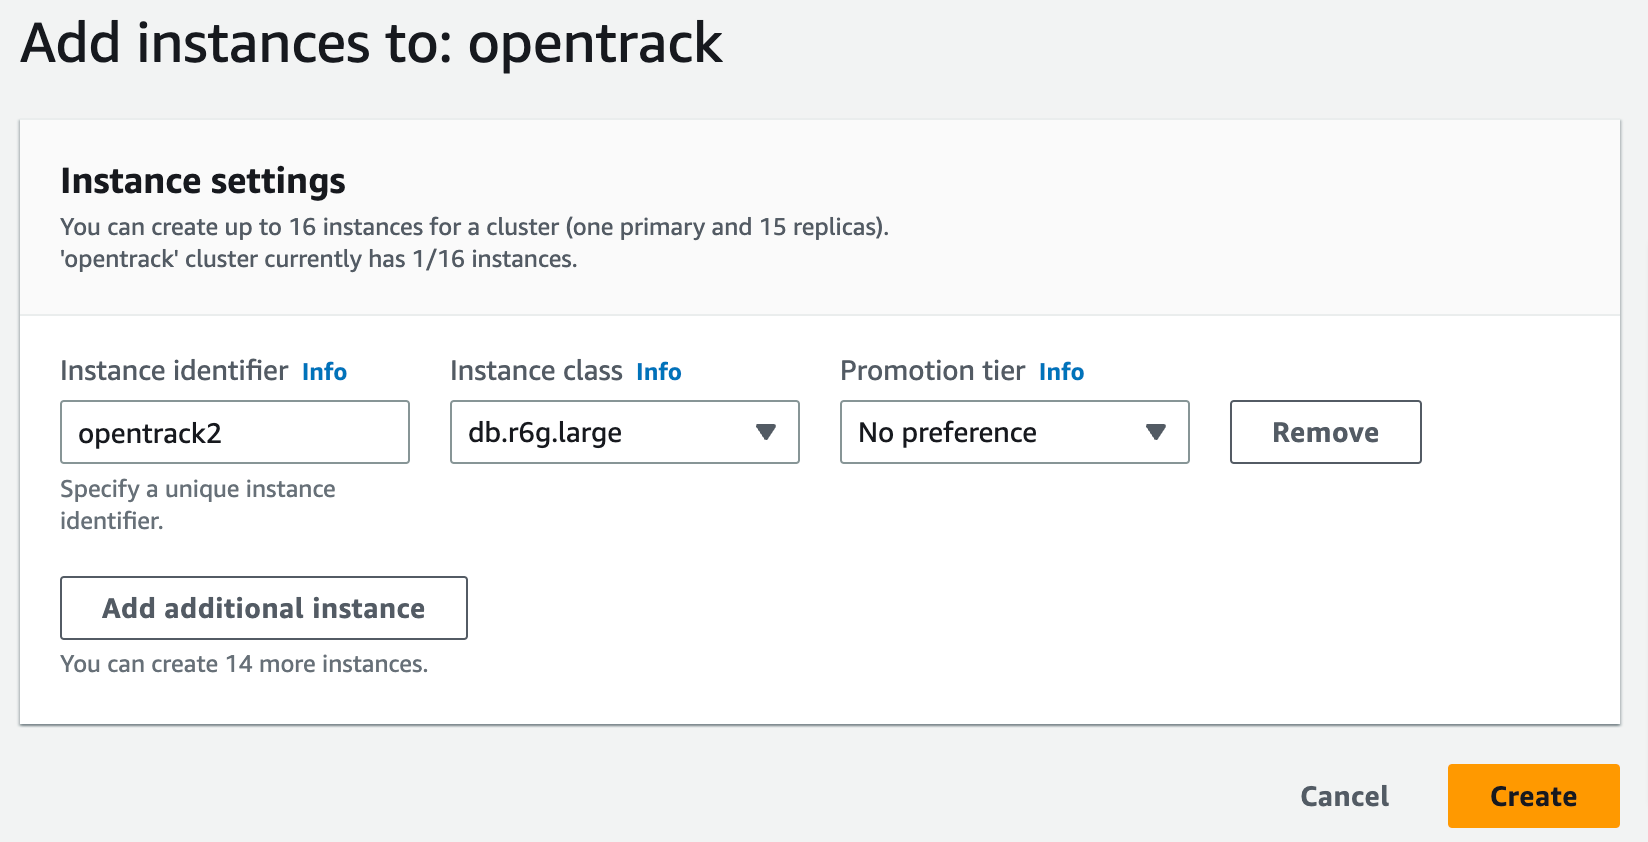

When deleting the replica databases, LEAVE THE PRIMARY ONE or we are all f****d.
Sentry errors
These give clues as to bugs and data issues. As one example, we saw a message saying "2.1" is not a valid round structure and Louis and I were able to see that Surrey had entered that instead of "2,1".
Stuck background tasks
If a task gives an error, it may suggest bad data. Dkango keeps retrying with a n exponential back-off. A green tick in the error column means you can click into it, see the traceback, and get a clue what's up. You can alert developers with an email, then in general you can delete failed tasks; the user might have fixed some data and re-run whatever report is needed.